Waveform analysis
PARTS AND MATERIALS
-
IBM-compatible personal computer with
sound card, running Windows 3.1 or better
-
Winscope software, downloaded free from
internet
-
Electronic "keyboard" (musical)
-
"Mono" (not stereo) headphone-type plug
for keyboard
-
"Mono" (not stereo) headphone-type plug
for computer sound card microphone input, with wires for
connecting to voltage sources
-
10 kΩ potentiometer
Parts and equipment for this experiment are
identical to those required for the "PC oscilloscope"
experiment.
CROSS-REFERENCES
Lessons In Electric Circuits, Volume
2, chapter 7: "Mixed-Frequency AC Signals"
LEARNING OBJECTIVES
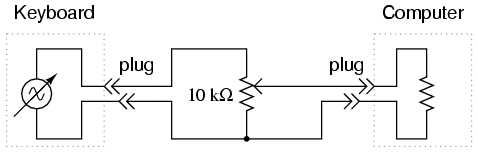
SCHEMATIC DIAGRAM
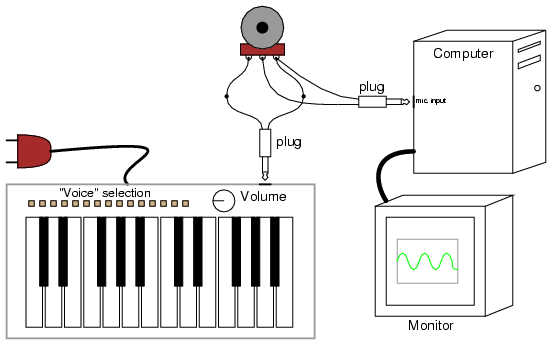
ILLUSTRATION
INSTRUCTIONS
The Winscope program comes with another
feature other than the typical "time-domain" oscilloscope
display: "frequency-domain" display, which plots amplitude
(vertical) over frequency (horizontal). An oscilloscope's
"time-domain" display plots amplitude (vertical) over time
(horizontal), which is fine for displaying waveshape.
However, when it is desirable to see the harmonic
constituency of a complex wave, a frequency-domain plot is
the best tool.
If using Winscope, click on the "rainbow"
icon to switch to frequency-domain mode. Generate a
sine-wave signal using the musical keyboard (panflute or
flute voice), and you should see a single "spike" on the
display, corresponding to the amplitude of the
single-frequency signal. Moving the mouse cursor beneath the
peak should result in the frequency being displayed
numerically at the bottom of the screen.
If two notes are activated on the musical
keyboard, the plot should show two distinct peaks, each one
corresponding to a particular note (frequency). Basic chords
(three notes) produce three spikes on the frequency-domain
plot, and so on. Contrast this with normal oscilloscope
(time-domain) plot by clicking once again on the "rainbow"
icon. A musical chord displayed in time-domain format is a
very complex waveform, but is quite simple to resolve into
constituent notes (frequencies) on a frequency-domain
display.
Experiment with different instrument
"voices" on the musical keyboard, correlating the
time-domain plot with the frequency-domain plot. Waveforms
that are symmetrical above and below their centerlines
contain only odd-numbered harmonics (odd-integer multiples
of the base, or fundamental frequency), while
nonsymmetrical waveforms contain even-numbered harmonics as
well. Use the cursor to locate the specific frequency of
each peak on the plot, and a calculator to determine whether
each peak is even- or odd-numbered.
|
