Power quality measurement
It used to be with large AC power systems
that "power quality" was an unheard-of concept, aside from
power factor. Almost all loads were of the "linear" variety,
meaning that they did not distort the shape of the voltage
sine wave, or cause non-sinusoidal currents to flow in the
circuit. This is not true anymore. Loads controlled by
"nonlinear" electronic components are becoming more
prevalent in both home and industry, meaning that the
voltages and currents in the power system(s) feeding these
loads are rich in harmonics: what should be nice, clean
sine-wave voltages and currents are becoming highly
distorted, which is equivalent to the presence of an
infinite series of high-frequency sine waves at multiples of
the fundamental power line frequency.
Excessive harmonics in an AC power system
can overheat transformers, cause exceedingly high neutral
conductor currents in three-phase systems, create
electromagnetic "noise" in the form of radio emissions that
can interfere with sensitive electronic equipment, reduce
electric motor horsepower output, and can be difficult to
pinpoint. With problems like these plaguing power systems,
engineers and technicians require ways to precisely detect
and measure these conditions.
Power Quality is the general term
given to represent an AC power system's freedom from
harmonic content. A "power quality" meter is one that gives
some form of harmonic content indication.
A simple way for a technician to determine
power quality in their system without sophisticated
equipment is to compare voltage readings between two
accurate voltmeters measuring the same system voltage: one
meter being an "averaging" type of unit (such as an
electromechanical movement meter) and the other being a
"true-RMS" type of unit (such as a high-quality digital
meter). Remember that "averaging" type meters are calibrated
so that their scales indicate volts RMS, based on the
assumption that the AC voltage being measured is sinusoidal.
If the voltage is anything but sinewave-shaped, the
averaging meter will not register the proper value,
whereas the true-RMS meter always will, regardless of
waveshape. The rule of thumb here is this: the greater the
disparity between the two meters, the worse the power
quality is, and the greater its harmonic content. A power
system with good quality power should generate equal voltage
readings between the two meters, to within the rated error
tolerance of the two instruments.
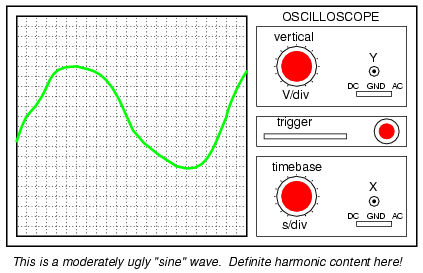
Another qualitative measurement of power
quality is the oscilloscope test: connect an oscilloscope
(CRT) to the AC voltage and observe the shape of the wave.
Anything other than a clean sine wave could be an indication
of trouble:
Still, if quantitative analysis (definite,
numerical figures) is necessary, there is no substitute for
an instrument specifically designed for that purpose. Such
an instrument is called a power quality meter and is
sometimes better known in electronic circles as a
low-frequency spectrum analyzer. What this instrument
does is provide a graphical representation on a CRT or
digital display screen of the AC voltage's frequency
"spectrum." Just as a prism splits a beam of white light
into its constituent color components (how much red, orange,
yellow, green, and blue is in that light), the spectrum
analyzer splits a mixed-frequency signal into its
constituent frequencies, and displays the result in the form
of a histogram:
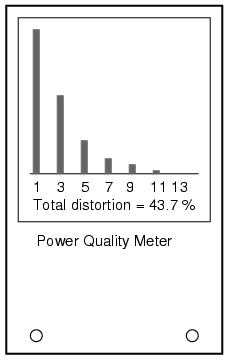
Each number on the horizontal scale of this
meter represents a harmonic of the fundamental frequency.
For American power systems, the "1" represents 60 Hz (the
1st harmonic, or fundamental), the "3" for 180 Hz
(the 3rd harmonic), the "5" for 300 Hz (the 5th harmonic),
and so on. The black rectangles represent the relative
magnitudes of each of these harmonic components in the
measured AC voltage. A pure, 60 Hz sine wave would show only
a tall black bar over the "1" with no black bars showing at
all over the other frequency markers on the scale, because a
pure sine wave has no harmonic content.
Power quality meters such as this might be
better referred to as overtone meters, because they
are designed to display only those frequencies known to be
generated by the power system. In three-phase AC power
systems (predominant for large power applications),
even-numbered harmonics tend to be canceled out, and so only
harmonics existing in significant measure are the
odd-numbered.
Meters like these are very useful in the
hands of a skilled technician, because different types of
nonlinear loads tend to generate different spectrum
"signatures" which can clue the troubleshooter to the source
of the problem. These meters work by very quickly sampling
the AC voltage at many different points along the waveform
shape, digitizing those points of information, and using a
microprocessor (small computer) to perform numerical Fourier
analysis (the Fast Fourier Transform or "FFT"
algorithm) on those data points to arrive at harmonic
frequency magnitudes. The process is not much unlike what
the SPICE program tells a computer to do when performing a
Fourier analysis on a simulated circuit voltage or current
waveform. |
